Odoo BI bietet Ihnen alles, was Sie für den Einstieg in das Business Reporting benötigen: Dashboards, Pivot-Ansichten und fertige Finanzberichte.
Es bildet eine solide Grundlage für wachsende Teams und kann bei Bedarf erweitert werden, um auch komplexere Anforderungen abzudecken.
Odoo bietet integrierte BI-Berichte
Odoo verfügt über einen leistungsfähigen Satz von Business-Intelligence-Tools: dashboards, Pivot-Tabellen, Finanzberichte und sogar eine Excel-ähnliche Oberfläche, die app-übergreifend funktioniert. Perfekt für Ad-hoc-Analysen und tägliche Geschäftsentscheidungen.
1. Finanzberichte
Odoo liefert standardmäßige Buchhaltungsberichte wie:
- Bilanz
- Gewinn- und Verlustrechnung
- Cashflow-Rechnung
Diese Berichte unterstützen Filter (Journale, Zeiträume etc.), Vergleichsperioden und Exportoptionen (PDF, Excel).
Sie lassen sich schnell generieren und eignen sich ideal für die regelmäßige Buchführung oder monatliche Übersichten.
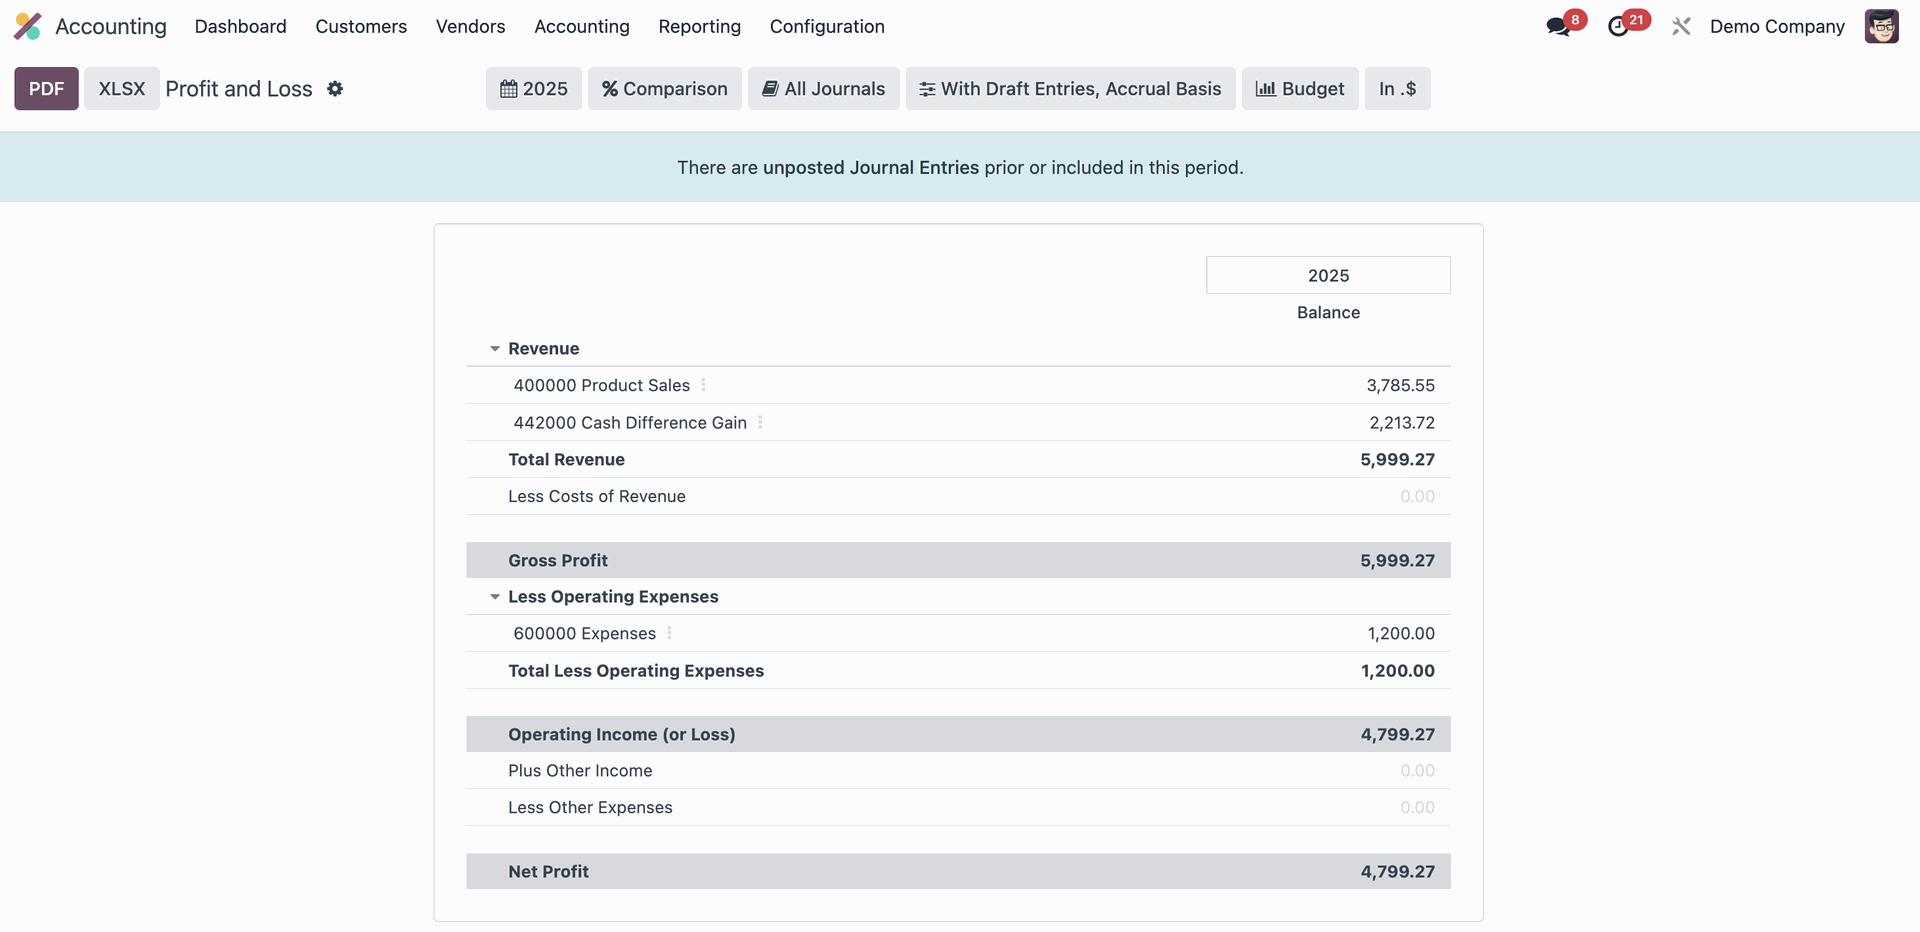
Odoo GuV-Bericht in der Buchhaltung
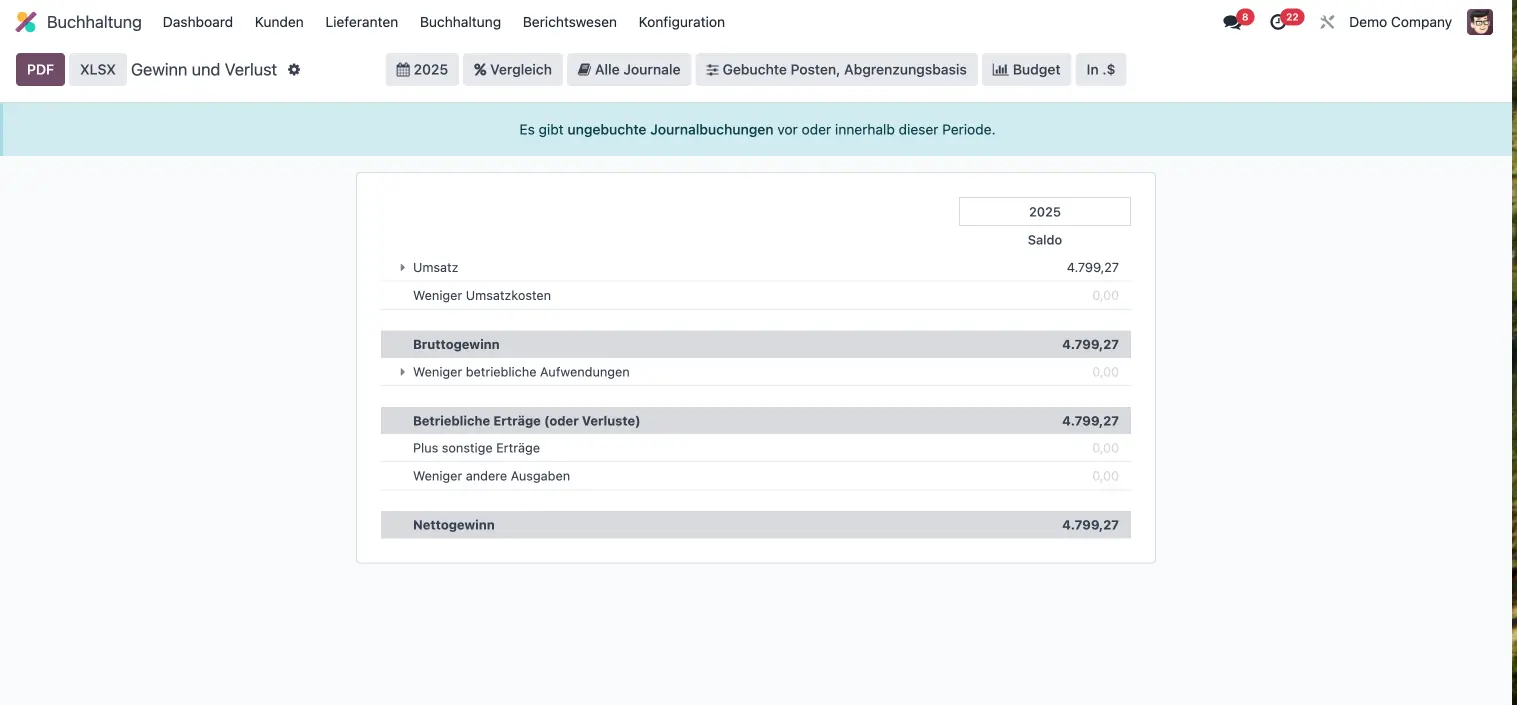
Odoo GuV-Bericht in der Buchhaltung
2. Dashboards & Excel-ähnliche Ansichten
Für Vertriebs- und andere operative Daten bietet Odoo::
- Vordefinierte Dashboards mit KPIs (z. B. Anzahl der Aufträge, Umsatz, durchschnittlicher Bestellwert)
- Trenddiagramme (z. B. monatliche Verkäufe)
- Aufschlüsselungstabellen nach Top-Produkten, Ländern oder Vertriebsmitarbeitern
- Eine Tabellenkalkulations-Ansicht für Finanzkennzahlen (Rentabilität, Liquidität, Solvenz etc.)
Dies funktioniert gut für das Management-Monitoring und die tägliche Geschäftsverfolgung.
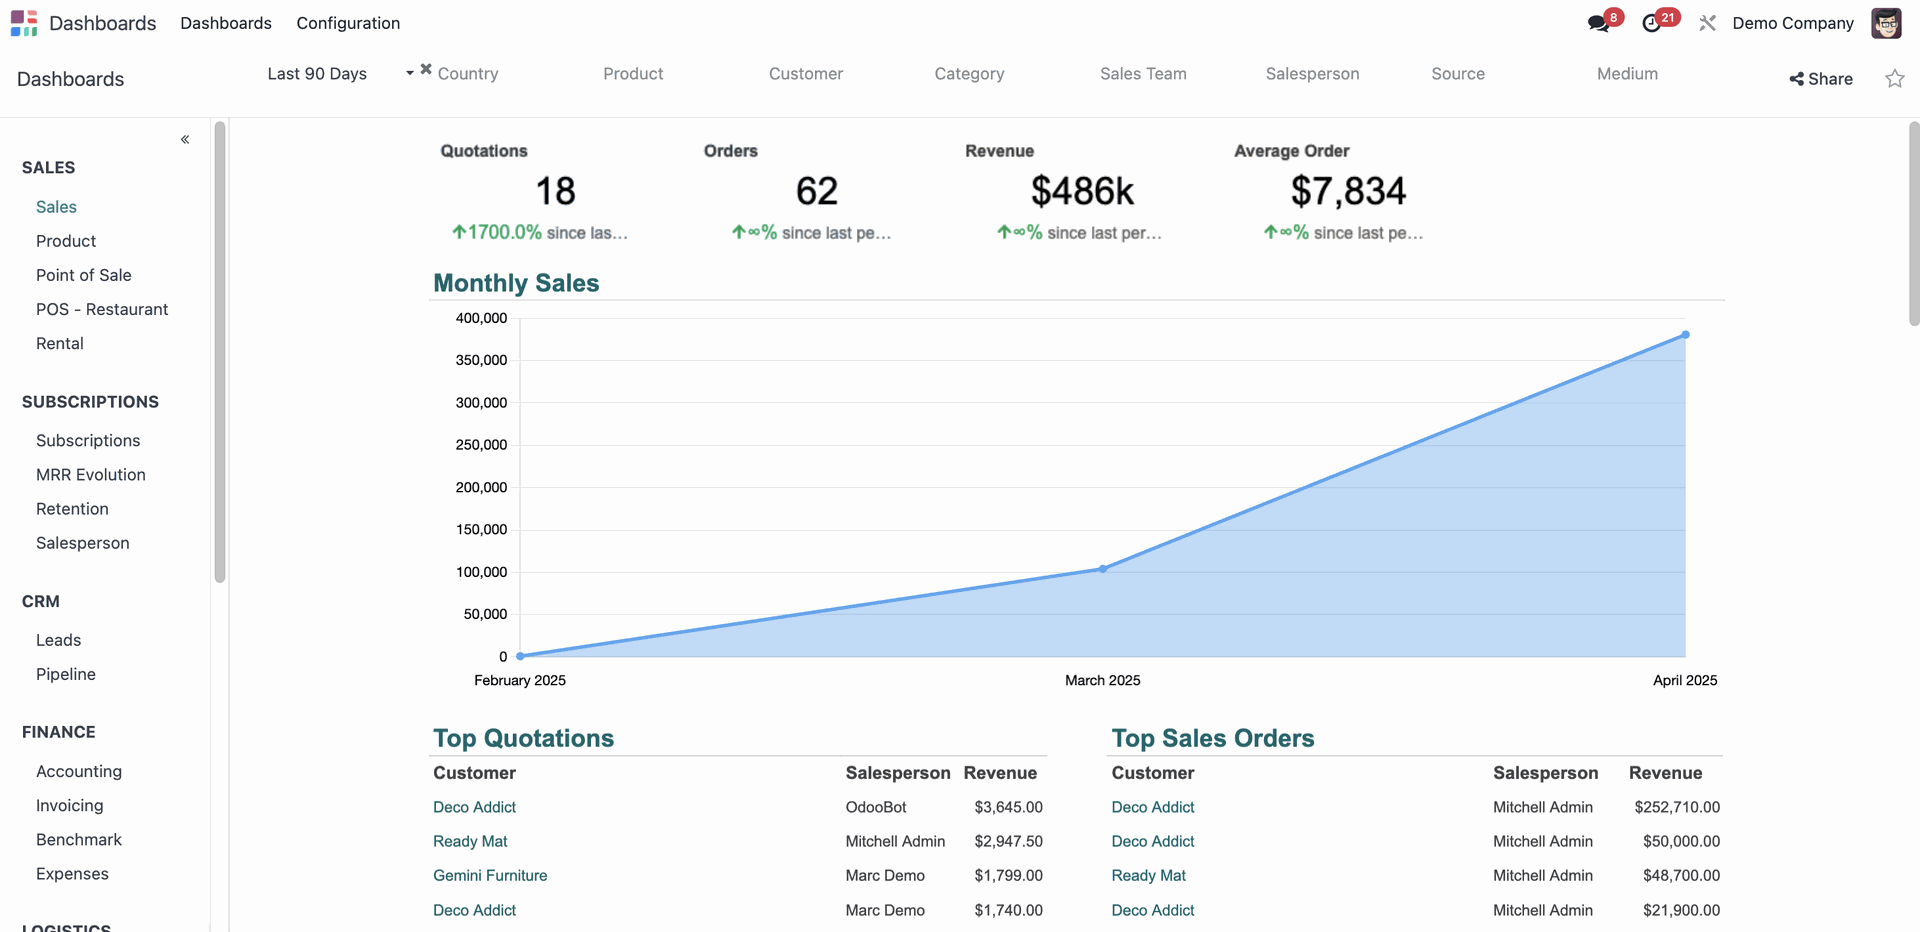
Odoo BI Dashboard App für den Vertrieb.
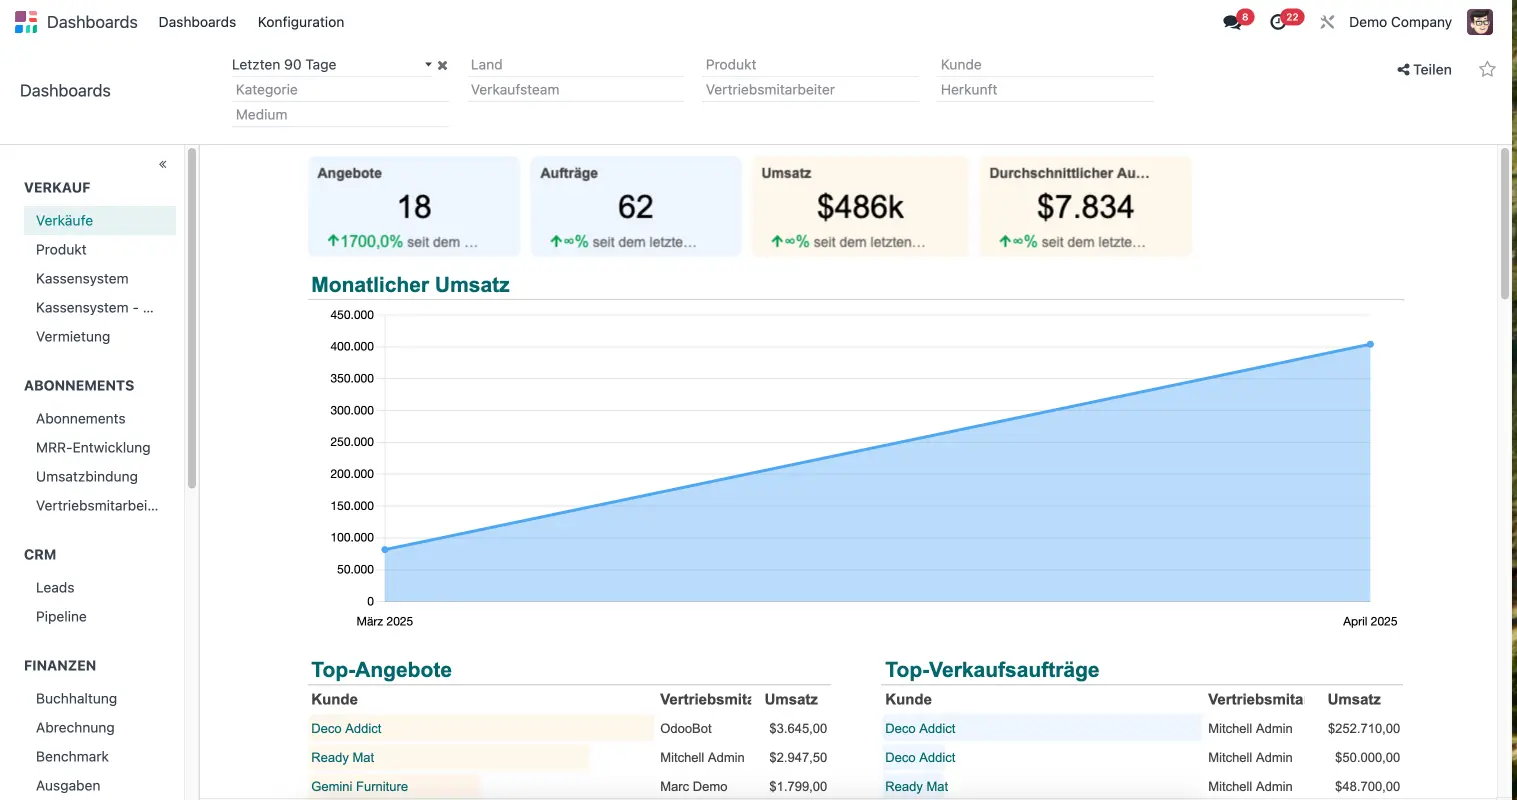
Odoo BI Dashboard App für den Vertrieb.
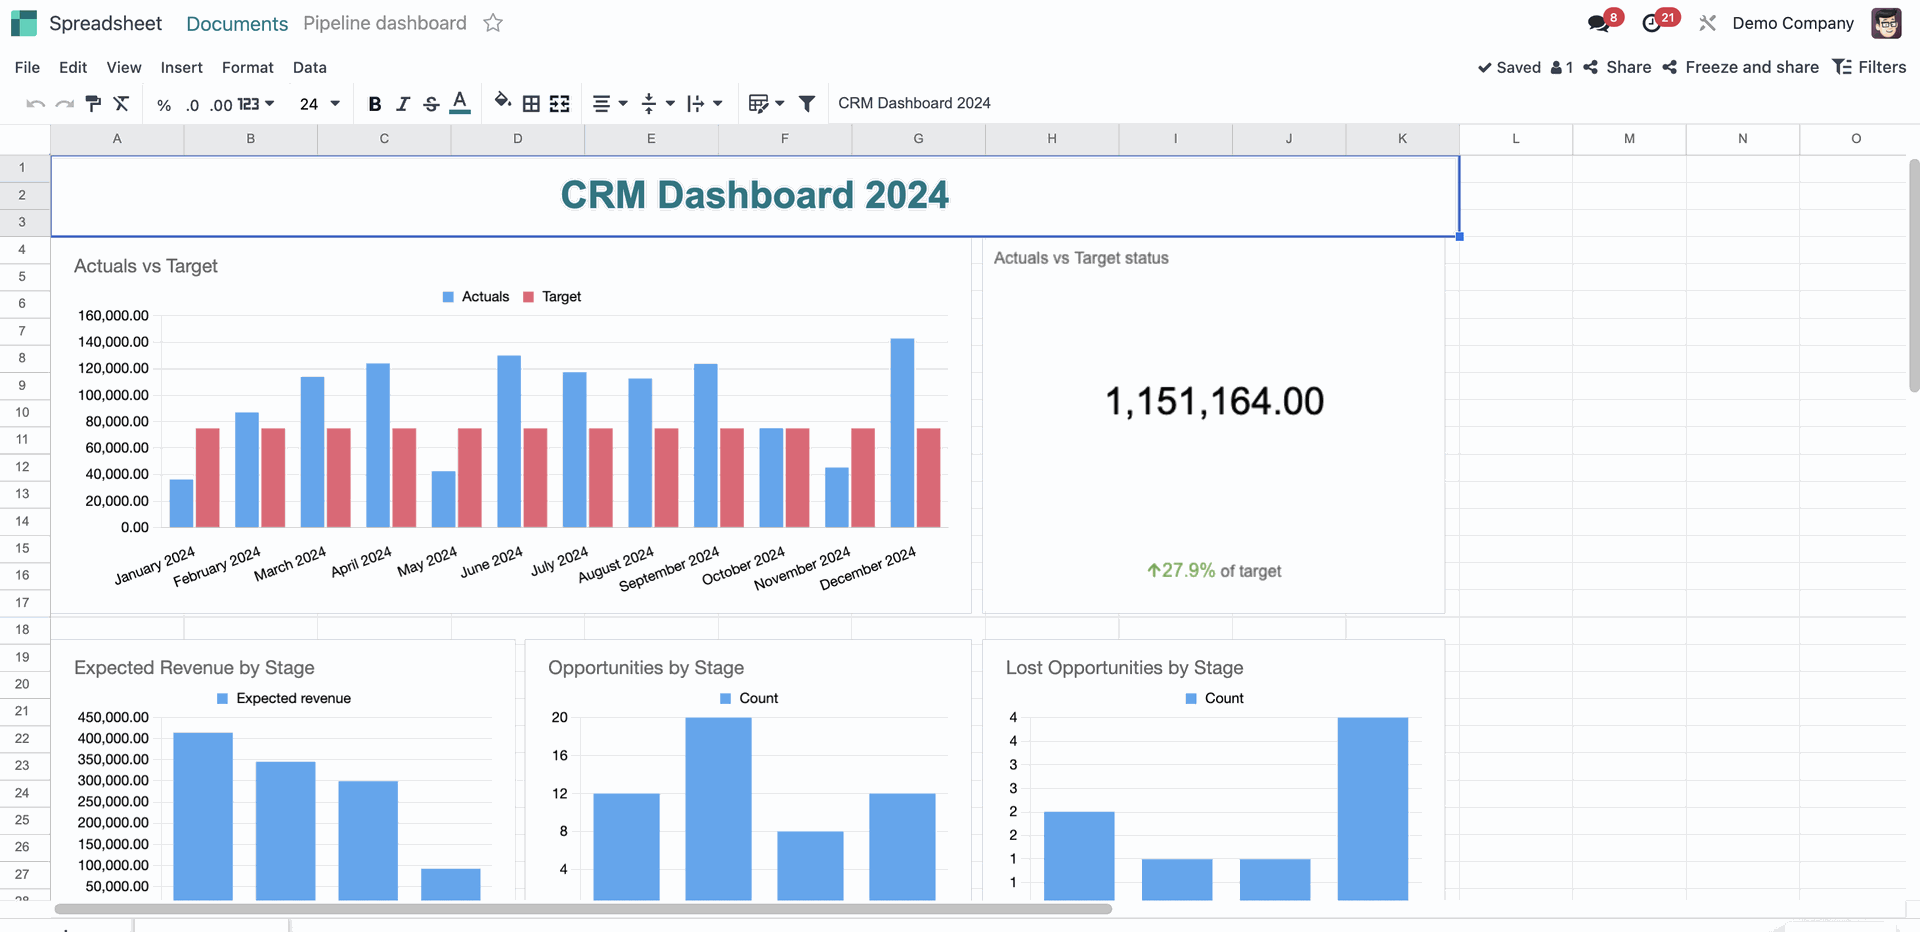
Odoo Excel-ähnliche Tabellenansicht mit CRM-Dashboard-Vorlage
3. Pivot-Ansichten & Geo-Visualisierung
Odoos Echtzeit- Pivot-Ansichten ermöglichen Nutzern, Daten beliebig zu segmentieren:
- Gruppierung nach Pipeline-Phase, Vertriebsmitarbeiter, Region oder Zeit
- Export oder Einbindung der Pivot-Tabelle in Dashboards oder Tabellen
- Aufklappbare Ebenen (wie Zwischensummen in Excel)
Zusätzlich gibt es eine Kartenansicht für standortbasierte Daten, hilfreich für Gebietsplanung und Vertriebsverteilung.
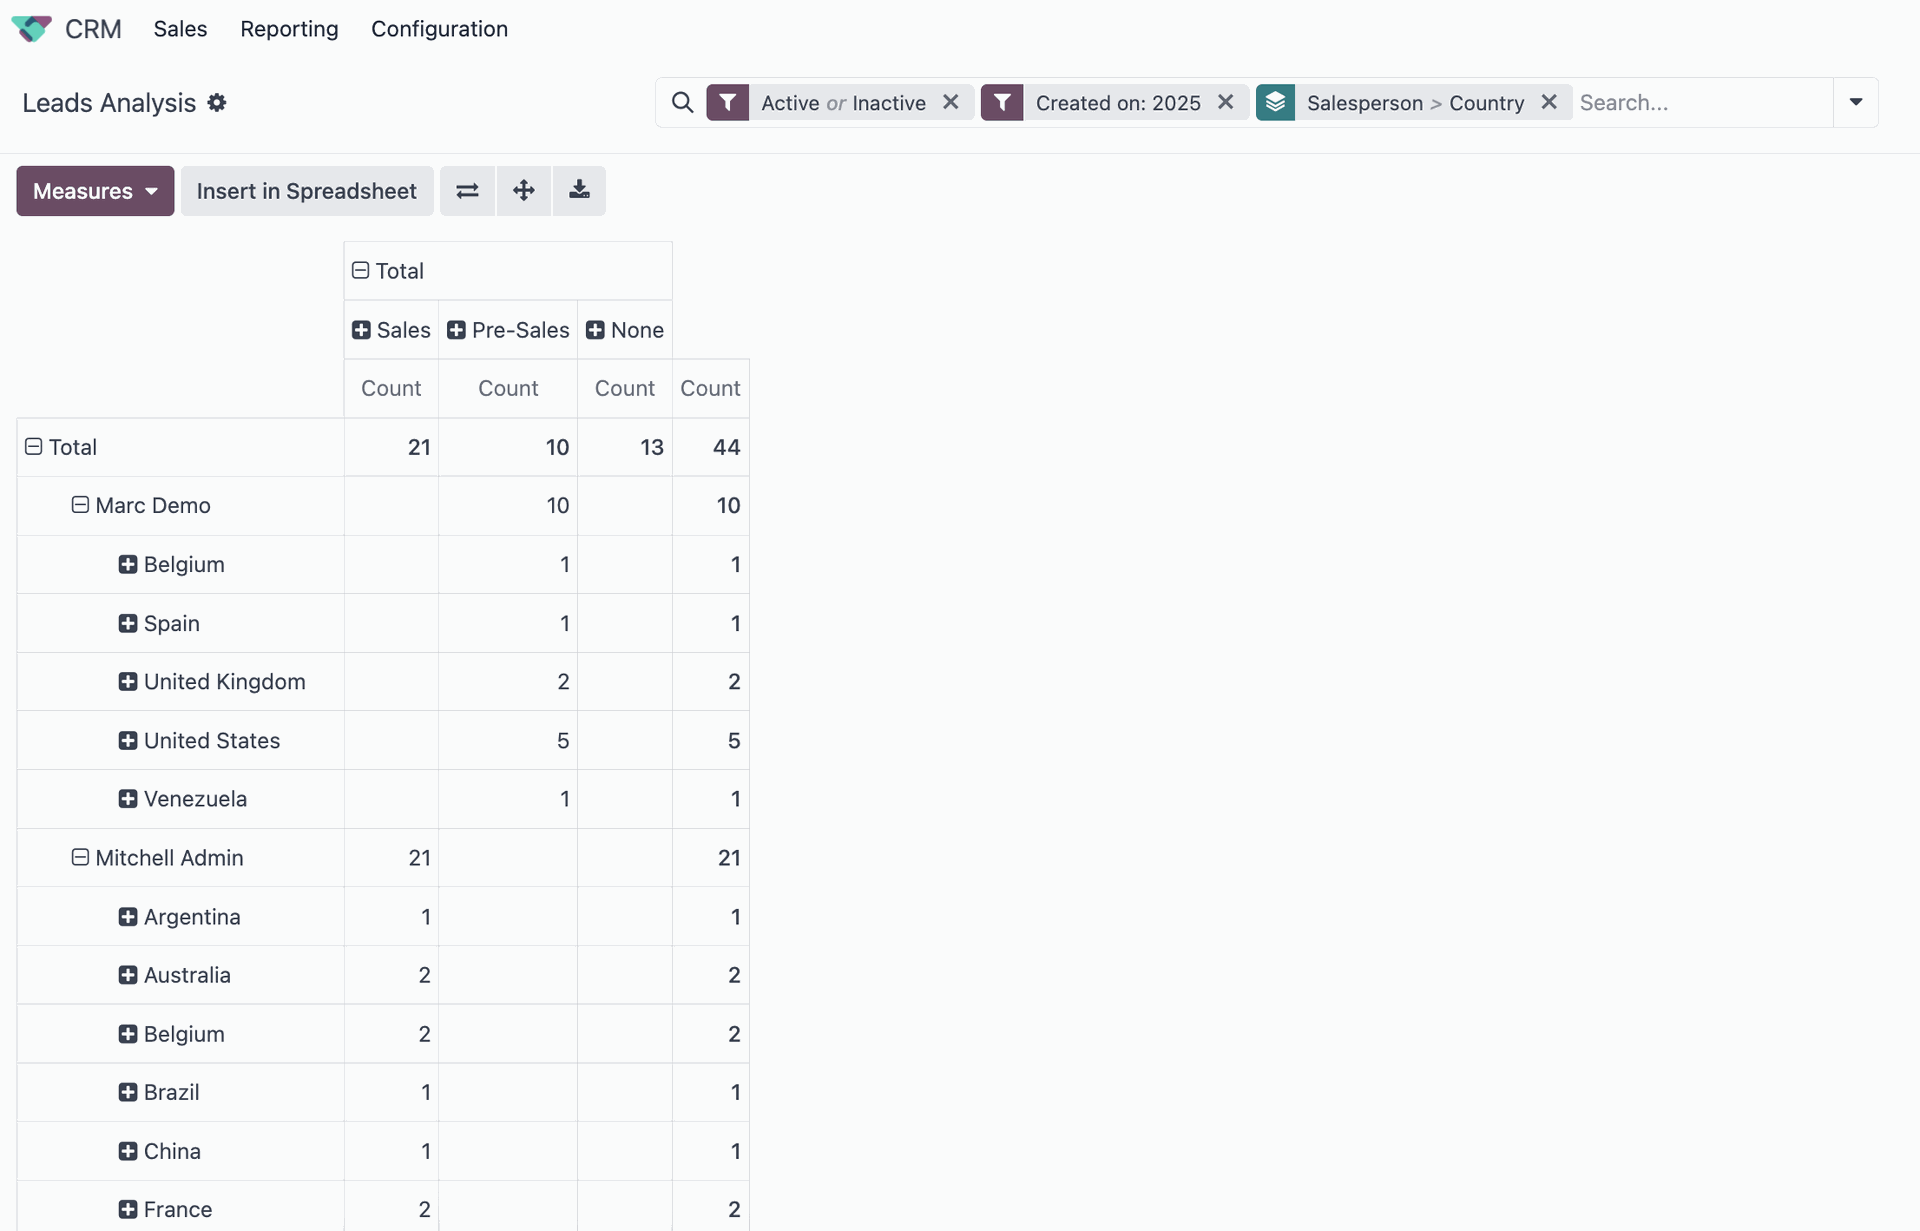
Odoo Pivot-Tabelle im CRM
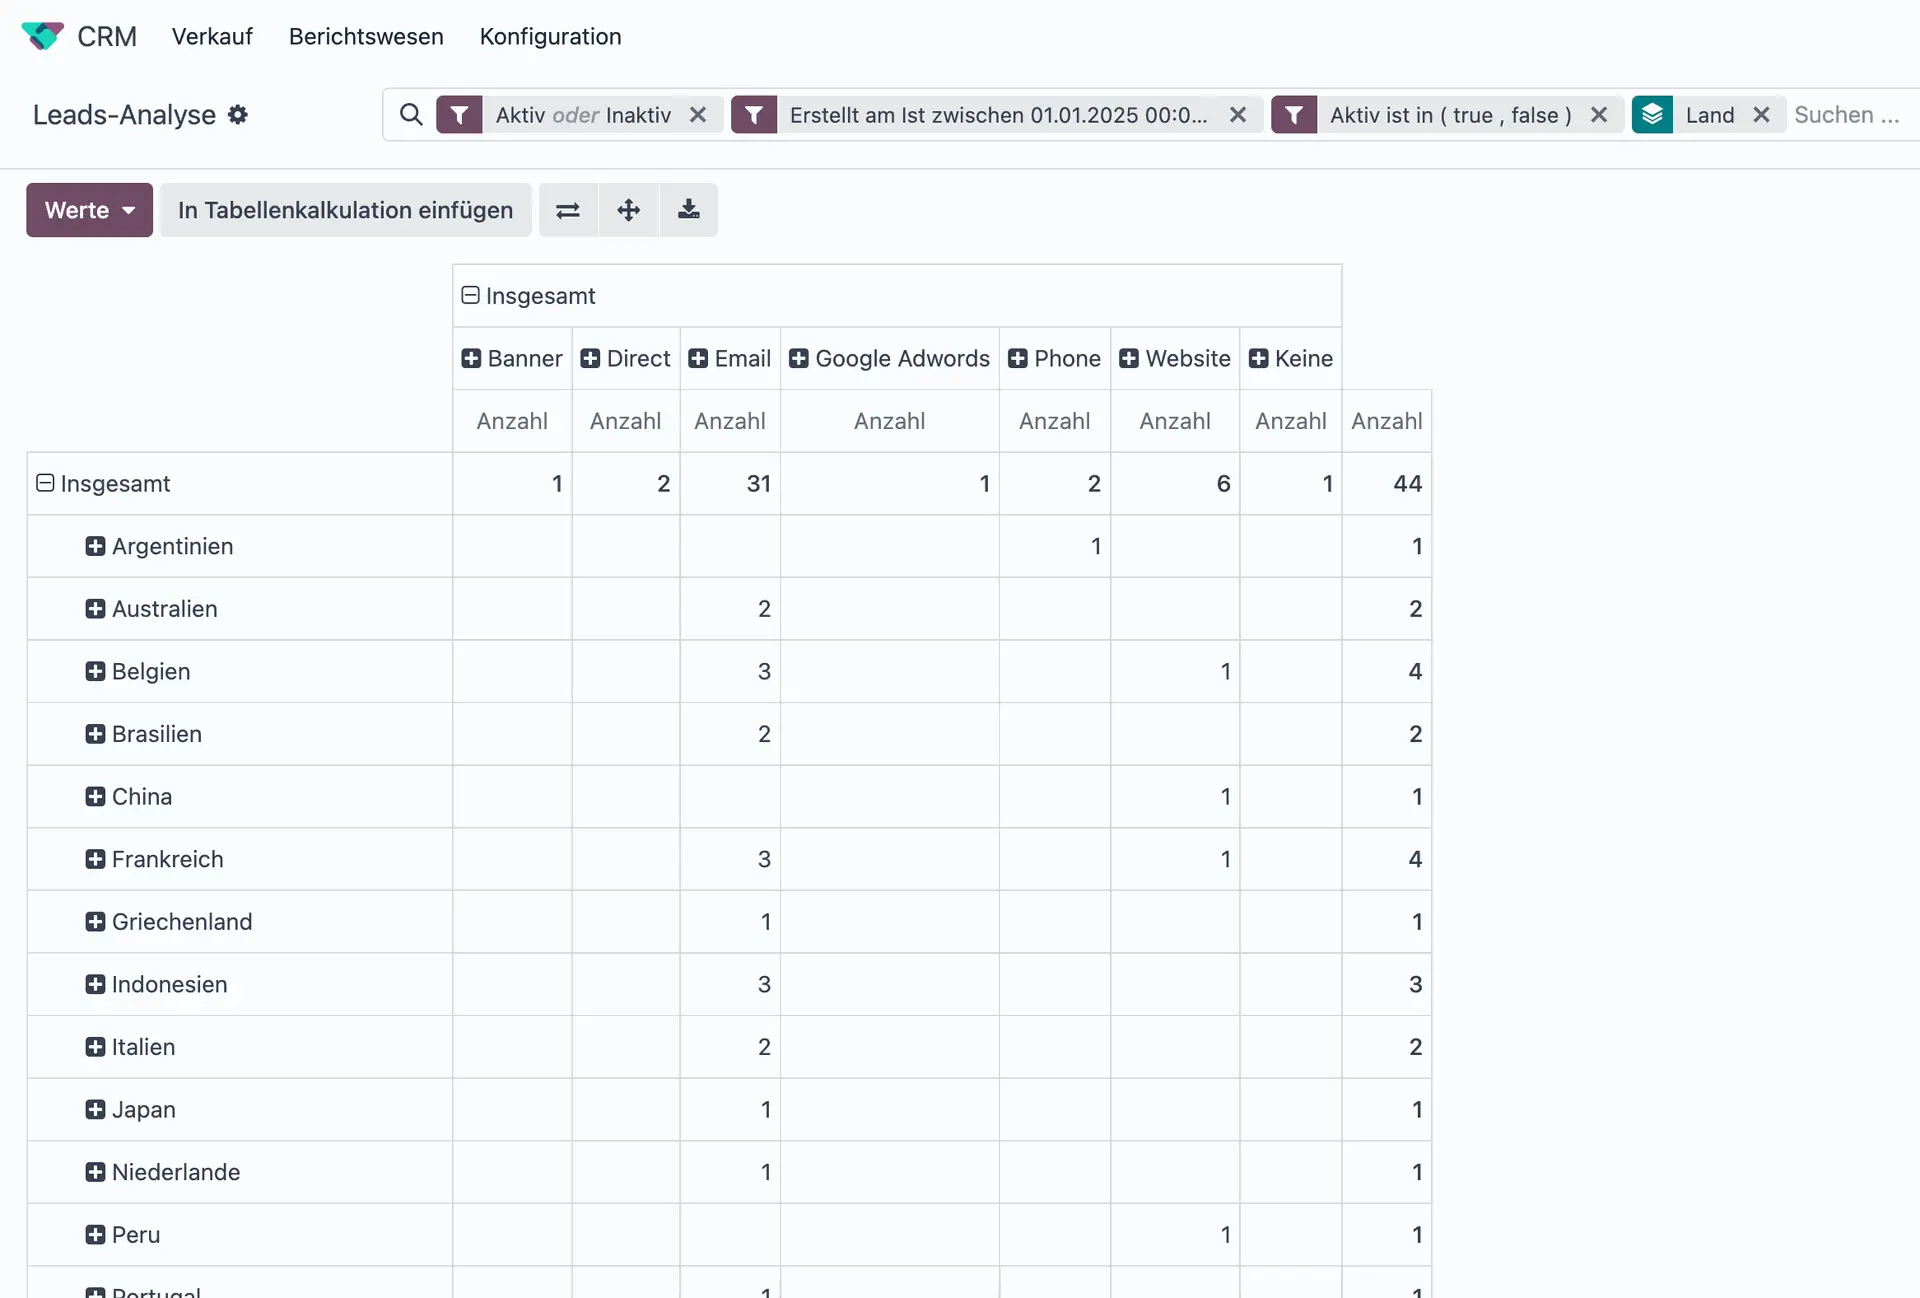
Odoo Pivot-Tabelle im CRM
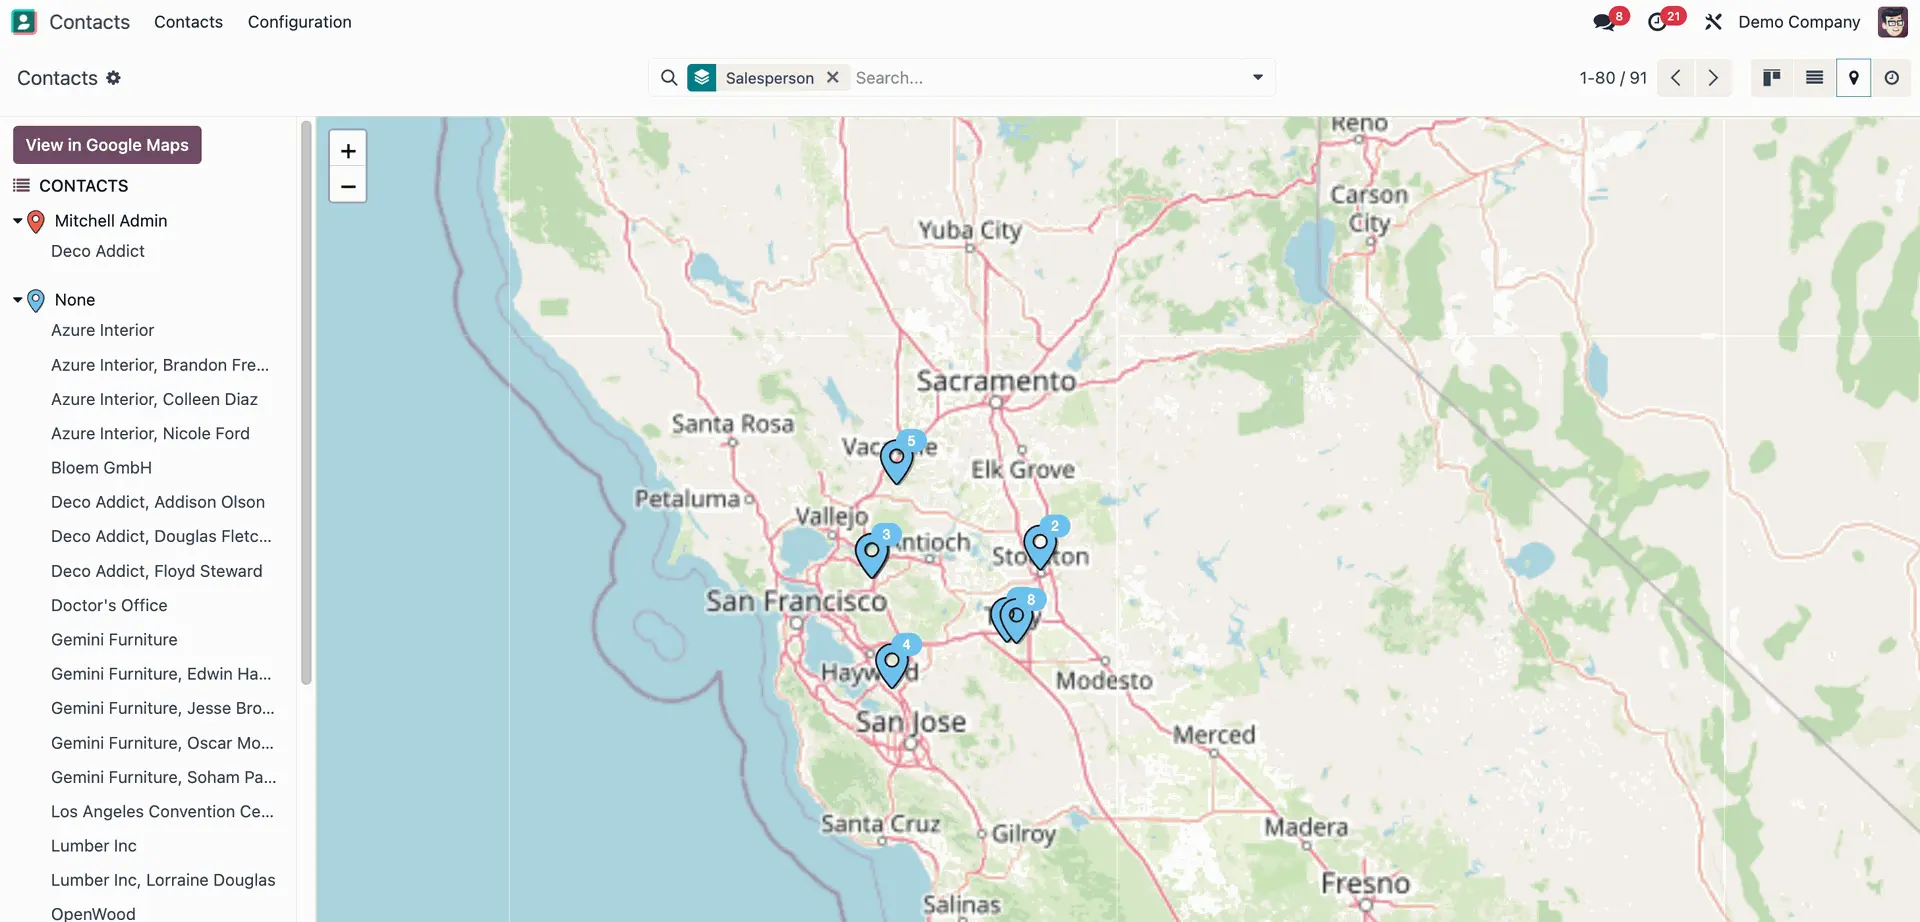
Odoo Kartenansicht für Kontakte, gefiltert nach Vertriebsmitarbeiter
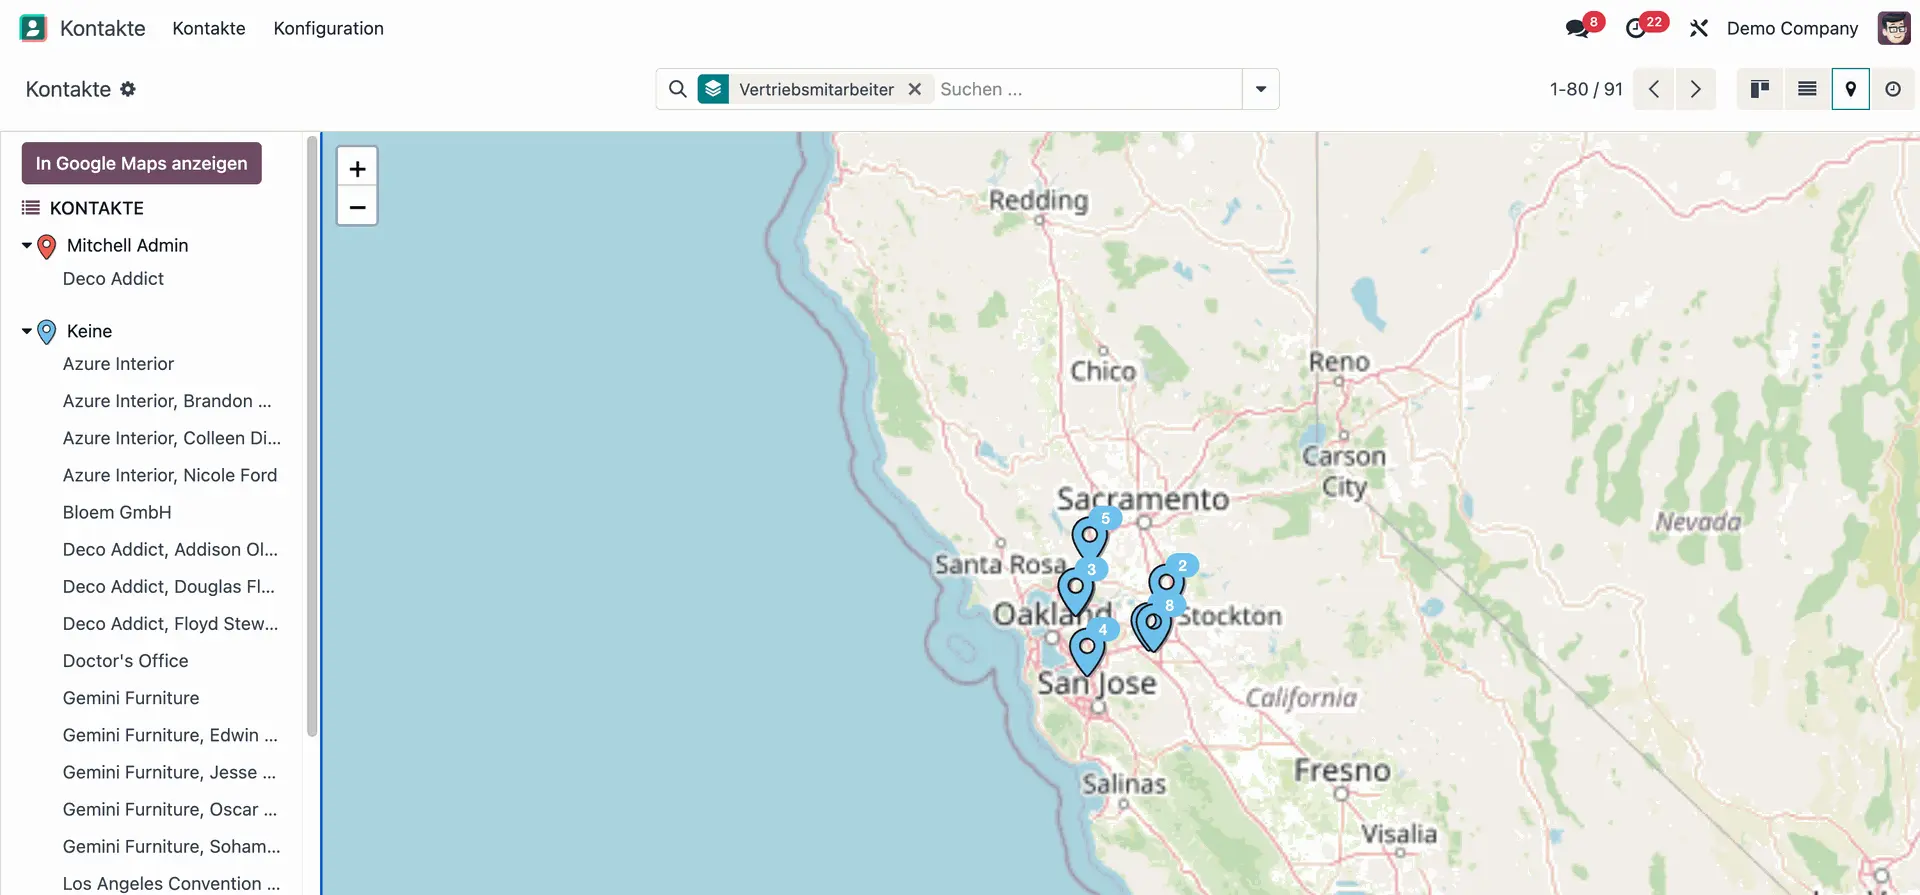
Odoo Kartenansicht für Kontakte, gefiltert nach Vertriebsmitarbeiter
4. Weitere Ansichten: Kalender, Dashboards, Berichte
- Kalenderansicht, um Fristen oder Aktivitäten nach Terminen zu visualisieren
- Berichtsgenerator mit Filtern und Exportoptionen
- Dashboards mit Live-KPIs und konfigurierbaren Diagrammen
- Teilbare Links zu Dashboards für internen Zugriff
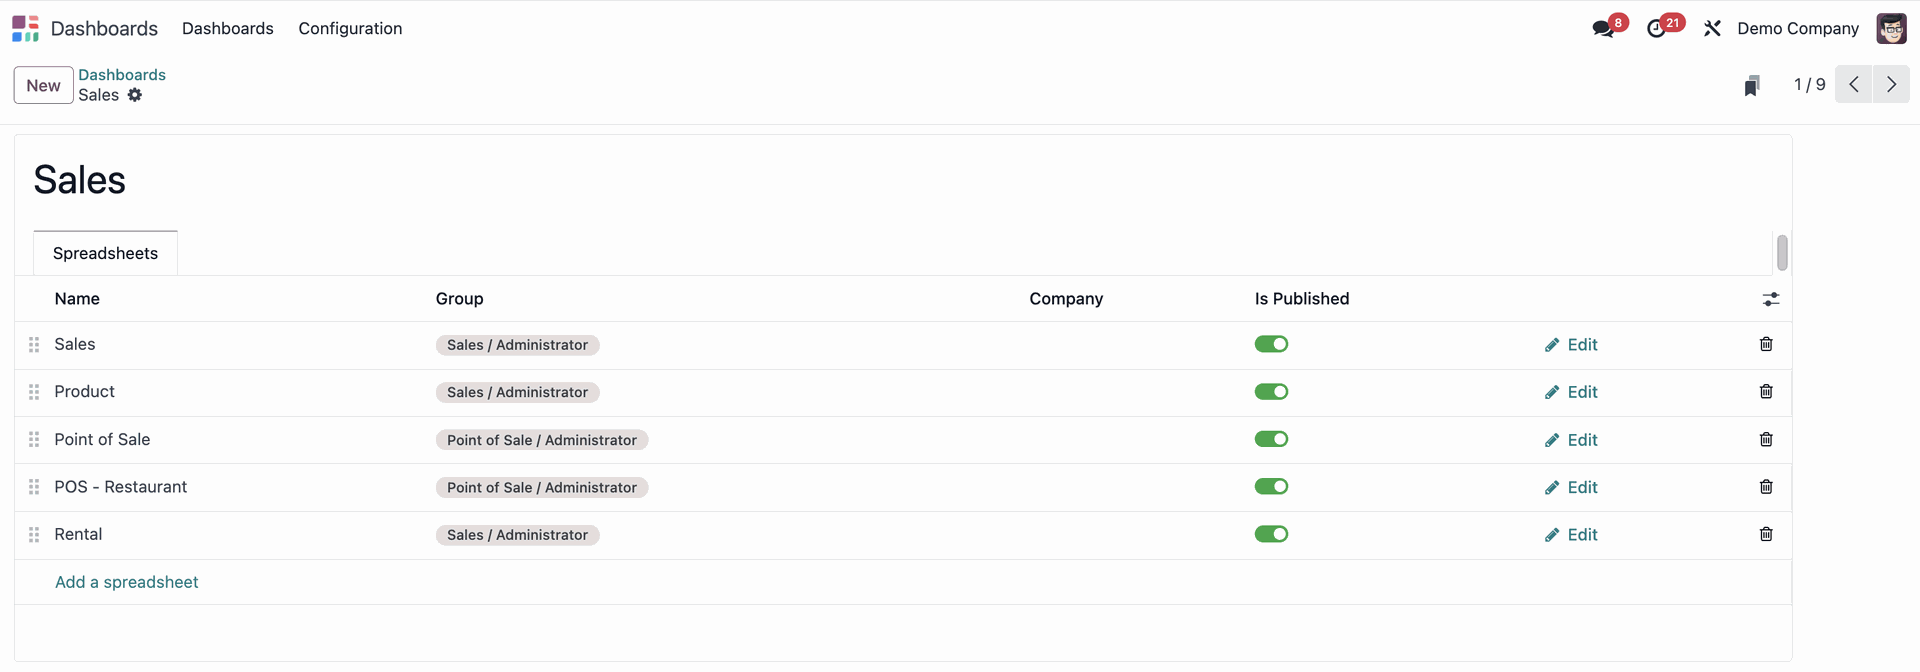
Odoo BI-Funktion – Dashboard-Konfiguration
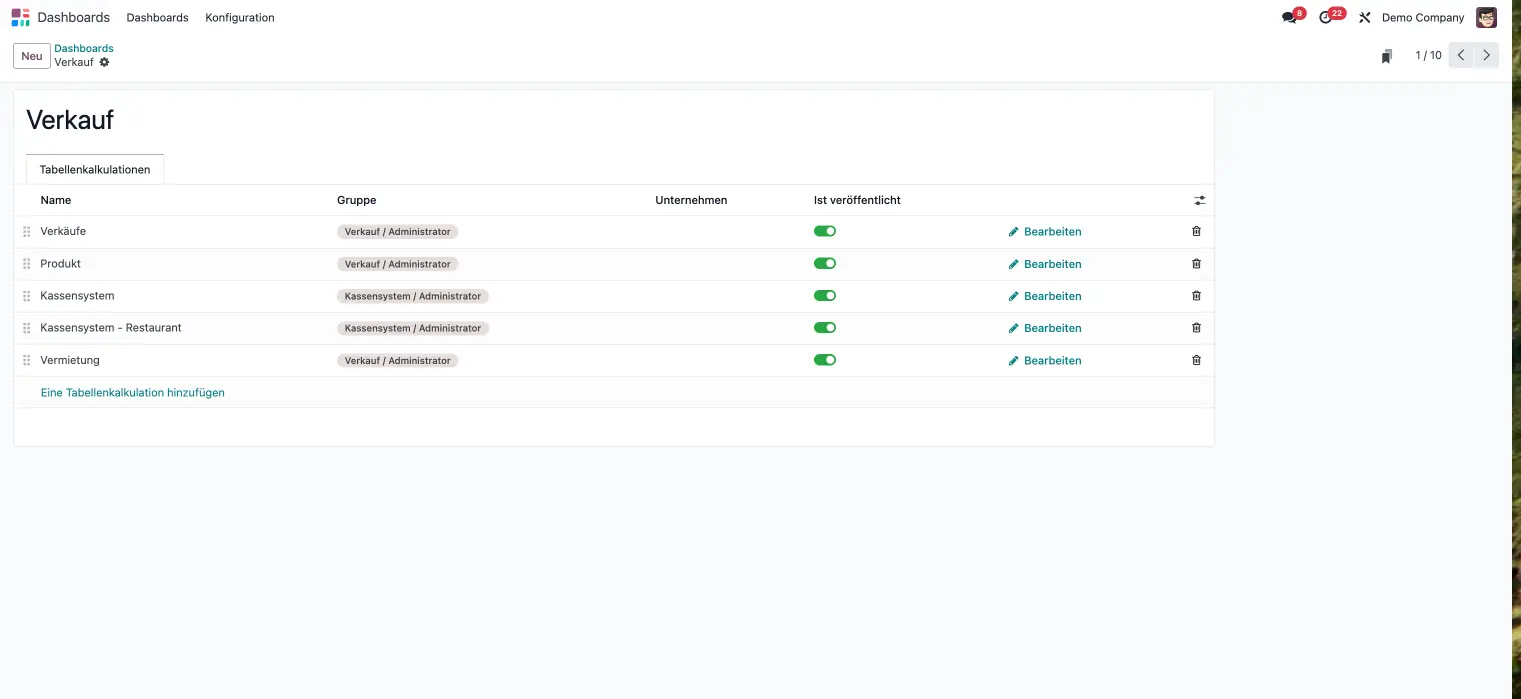
Odoo BI-Funktion – Dashboard-Konfiguration
Odoos integrierte BI hat jedoch Grenzen
Obwohl die obengenannten Berichte gute allgemeine Geschäftseinblicke liefern, sind sie in folgenden Punkten eingeschränkt:
- Nur eine App gleichzeitig: App-übergreifende Analysen sind standardmäßig begrenzt (z. B. Umsatz vs. Projektstunden).
- Keine externen Daten: Daten aus anderen Tools wie Shopify, Google Ads oder Legacy-Systemen können nicht eingebunden werden.
- Begrenzte Visualisierungen: Es gibt keinen Drag-and-Drop-Diagramm-Editor oder benutzerdefinierte Visualisierungen wie Trichter oder erweiterte Karten.
- Manuelle Einrichtung: Komplexere Dashboards erfordern oft Entwicklerunterstützung oder technische Workarounds.
Odoo lässt sich mit externen BI-Tools erweitern
Für anspruchsvollere Reporting-Anforderungen können Sie Odoo mit externen BI-Tools wie Power BI, Tableau oder individuell entwickelten Dashboards verbinden.
Mit der passenden Integration können Sie:
- Daten aus Odoo und externen Quellen zusammenzuführen,
- Individuelle Dashboards und erweiterte Visualisierungen erstellen,
- Prognosen und Datenmodelle entwickeln,
- Berichtszustellung für verschiedene Teams oder Rollen automatisieren.
Odoos integrierte BI-Funktionen sind bereits leistungsstark und decken die meisten alltäglichen Analysebedürfnisse ab.
Sie können schnelle Auswertungen durchführen, Ihre Daten in Pivot-Ansichten erkunden und Ihr Unternehmen in Echtzeit überwachen, alles direkt innerhalb des Systems.
Wenn Sie jedoch tiefere Einblicke und umfassendere Analysen wünschen, ist es sinnvoll, Odoo mit einer fortschrittlicheren BI-Lösung zu verbinden.
Odoo BI wird skalierbar durch Data Warehousing
Mit wachsendem Datenvolumen stößt Odoos integriertes Reporting irgendwann an seine Grenzen.
Große Berichte benötigen mehr Rechenzeit, und die Leistung der Datenbank kann spürbar nachlassen.
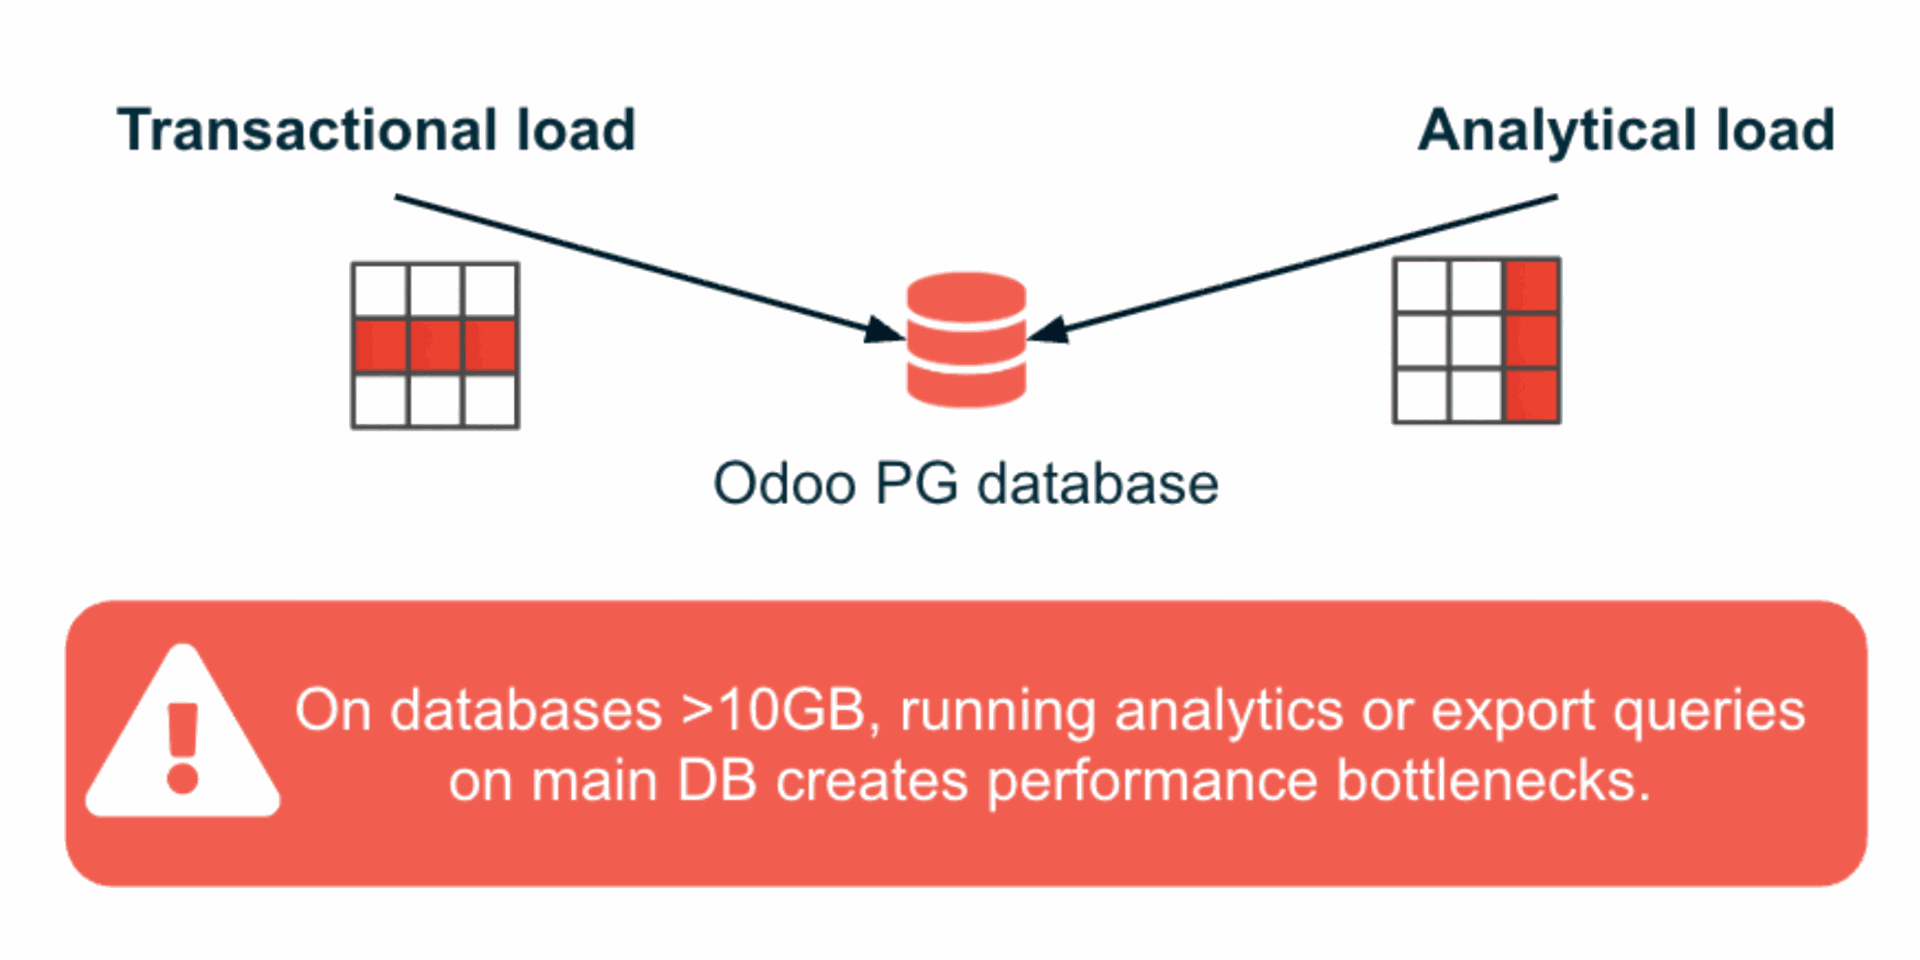
Odoo-Datenbanken mit über 10 GB stoßen häufig auf Performance-Probleme, sobald umfangreiche Analysen durchgeführt werden.
Um Odoo weiterhin schnell und stabil zu halten, unterstützen wir Unternehmen dabei, ihre umfangreichen Analyseprozesse aus dem Odoo-System auszulagern in ein dediziertes Data Warehouse.
Ein Data Warehouse dient als separate Analyseumgebung, die speziell für Reporting und Datenaufbereitung optimiert ist.
Es erhält in Echtzeit eine Kopie Ihrer Odoo-Daten, sodass Dashboards und Abfragen immer aktuell bleiben, ohne die Hauptdatenbank zu belasten oder den laufenden Betrieb zu verlangsamen.
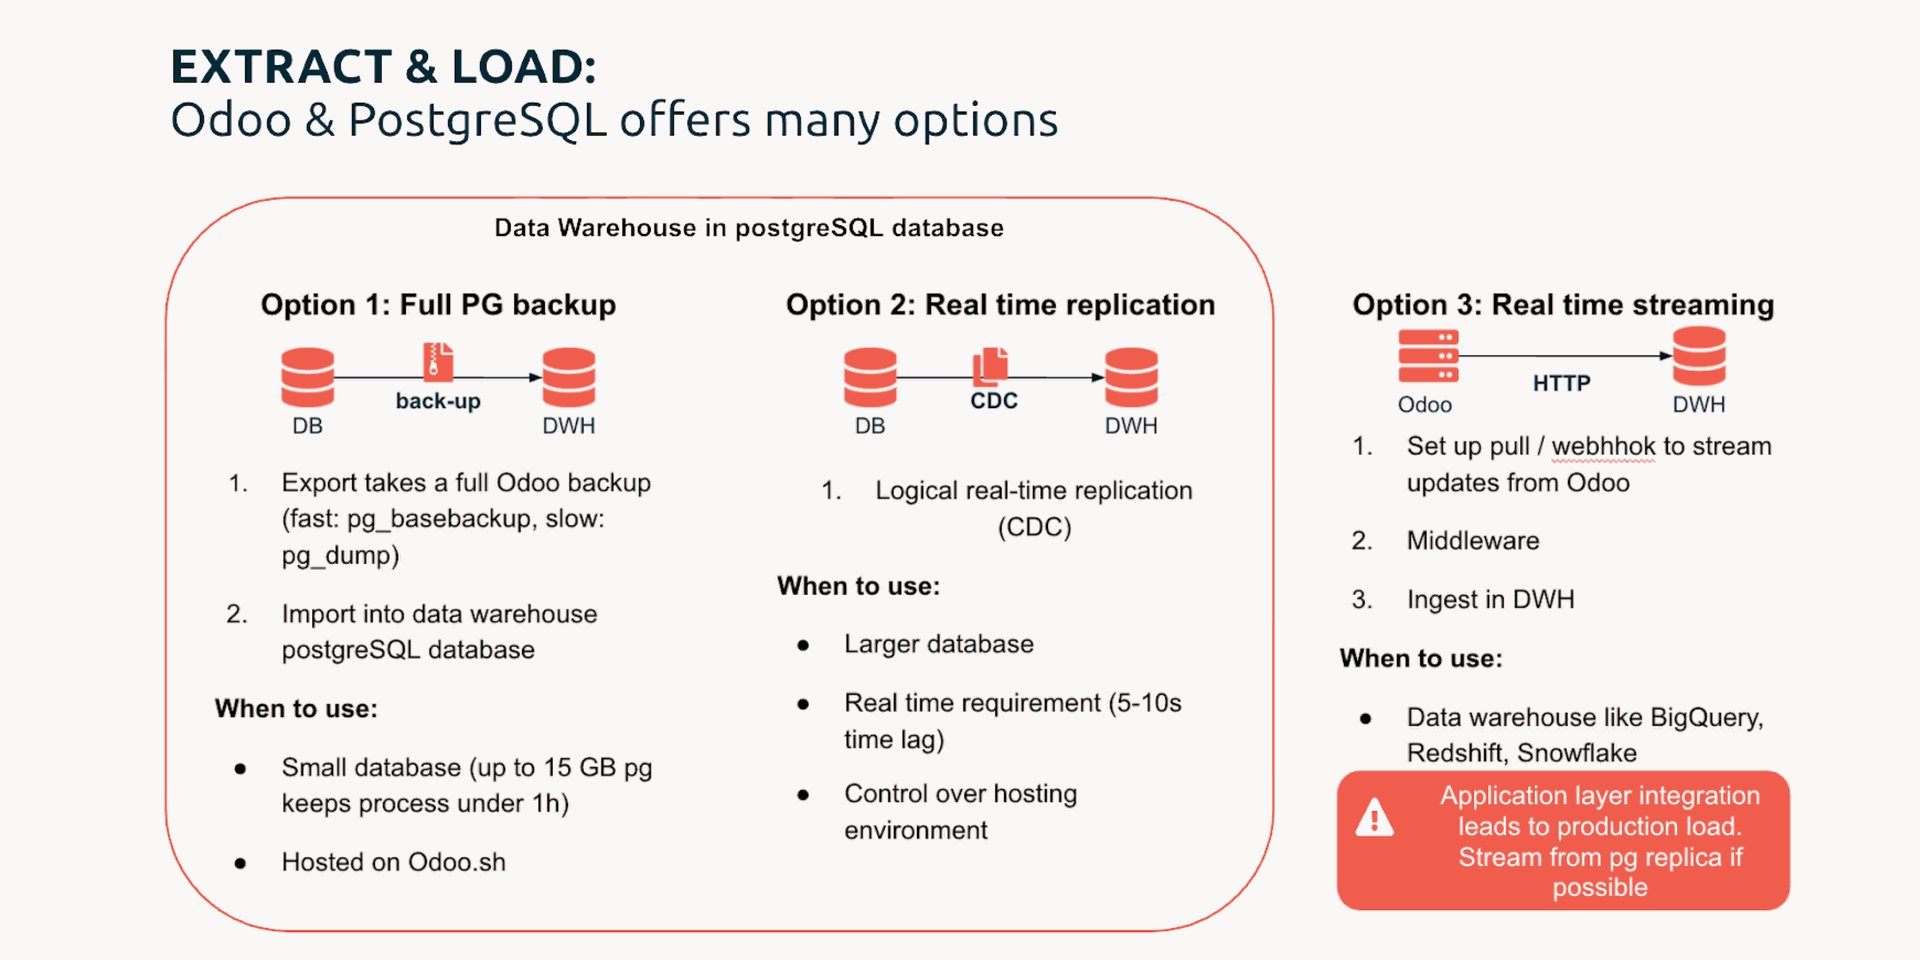
Die sogenannte Extract & Load-Methode mit Odoo und PostgreSQL eignet sich hervorragend für viele Anwendungsfälle, bei denen Daten laufend synchronisiert werden müssen.
Im Data Warehouse werden die Daten anschließend neu strukturiert und bereinigt, sodass sie übersichtlich und leicht verständlich sind, anstelle der komplexen Rohdatenstrukturen aus Odoo. So lassen sich Berichte deutlich schneller verarbeiten, und die Daten bleiben auch bei wachsender Datenbankgröße konsistent.
Im nächsten Schritt können Tools wie Power BI, Tableau oder Superset direkt mit dem Warehouse verbunden werden.
Dort werden die Odoo-Daten mit Informationen aus anderen Systemen zusammengeführt.
So entsteht eine einheitliche, verlässliche Datenbasis für tiefgehende Analysen.
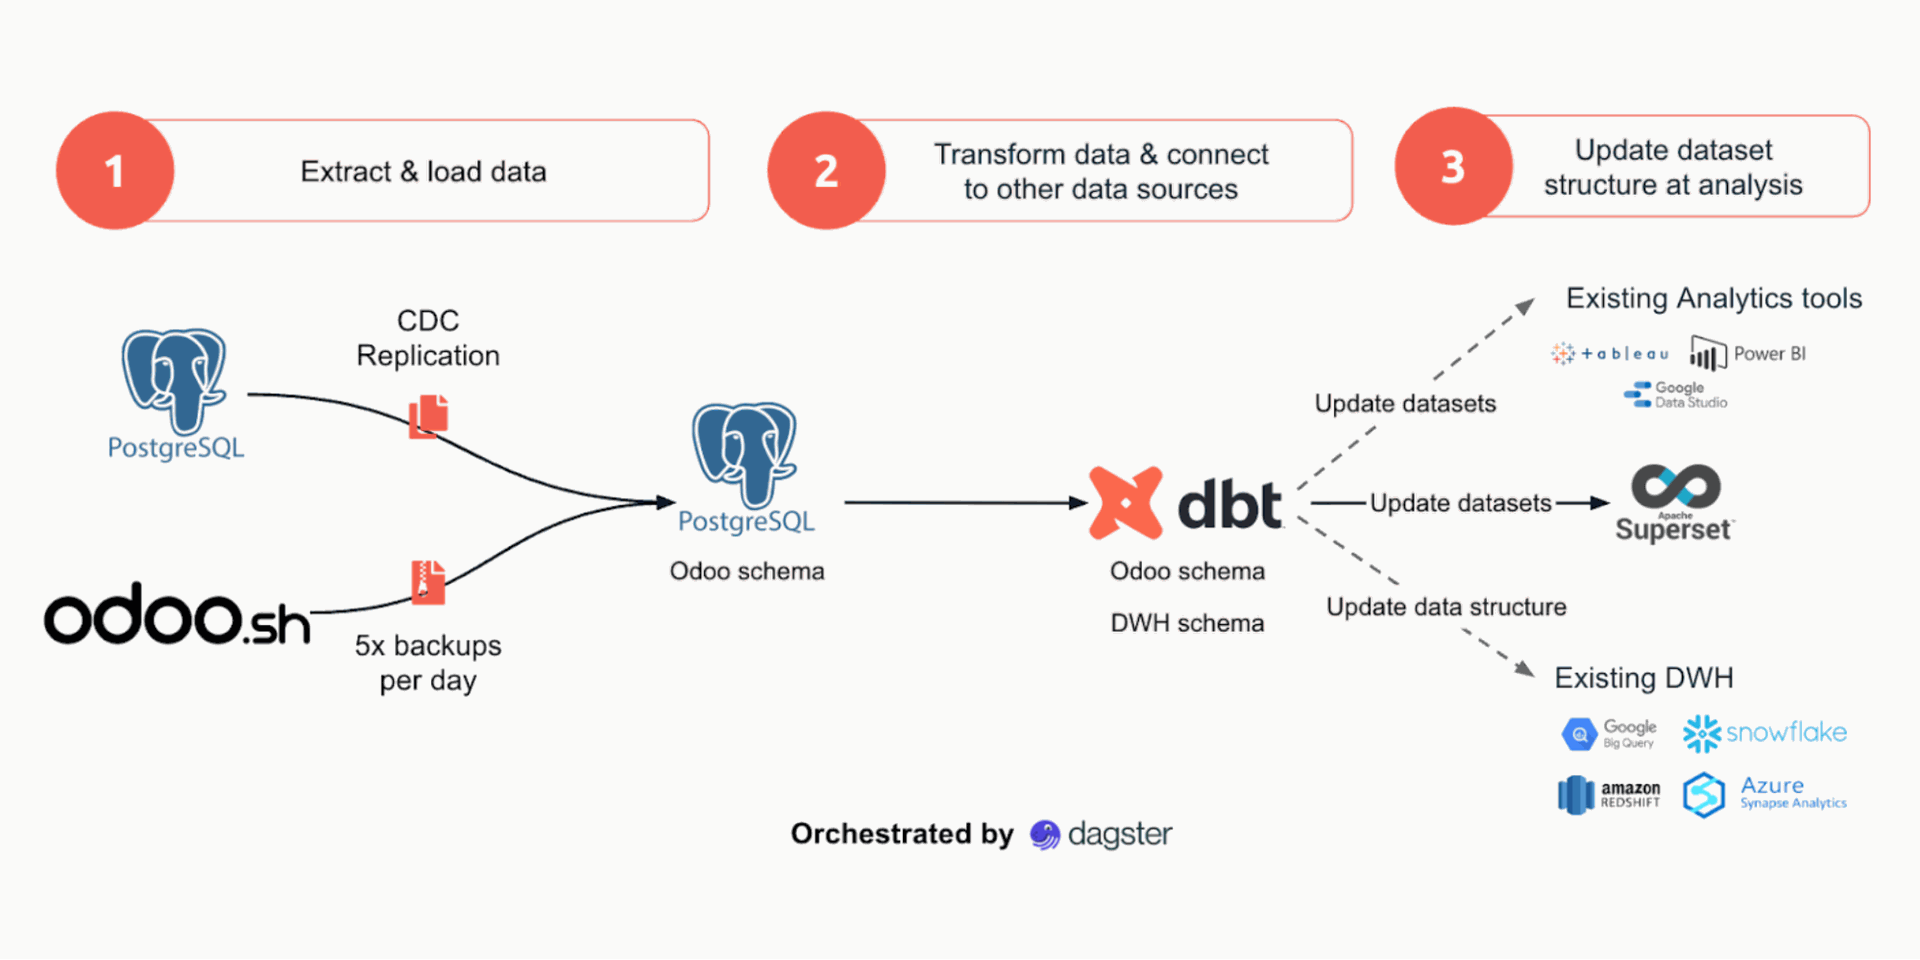
Unsere Odoo-BI-Lösung nutzt dbt und Dagster, um Odoo-Daten zu replizieren und für die Analyse in dem BI-Tool Ihrer Wahl aufzubereiten.
Auf diese Weise bleibt Odoo weiterhin für das tägliche operative Geschäft zuständig, während das Data Warehouse die Grundlage für fortgeschrittene Analysen und Echtzeit-Einblicke liefert – stets mit aktuellen Odoo-Daten.
Dieses Setup hält Ihr BI schnell, skalierbar und zukunftssicher.
Die Vorteile von Odoo BI mit Data Warehousing
Vereinfachte Datenstruktur: Ein optimiertes Datenmodell macht Odoo-Daten leichter verständlich und beschleunigt die Analyseprozesse Ihres BI-Teams.
Vernetzte Datenquellen: Durch die Integration mehrerer Systeme entsteht eine ganzheitliche Sicht auf alle Unternehmensbereiche.
Erweiterte Analysen: Spezialisierte Tools ermöglichen tiefere Prognosen, Machine-Learning-Modelle und KI-gestützte Analysen.
Sichere Datenverwaltung: Separate Zugriffsrechte und Datenanonymisierung gewährleisten Datenschutz und Compliance.
Auf der Odoo Experience 2025 haben wir die technischen und praktischen Aspekte einer erweiterten Odoo-BI-Architektur genauer vorgestellt:
Integrieren Sie Odoo BI mit fortgeschrittenen Analyse-Lösungen
Sprechen Sie mit unseren Experten darüber, wie Sie das volle Potenzial von Odoo BI ausschöpfen können.
Wir helfen Ihnen, die optimale Kombination aus Odoo und BI-Setup für Ihre Anforderungen zu finden.