Berichte und Analysen im ERP-System zu erstellen, kann eine echte Geduldsprobe sein.
Man muss sich mühsame Klickpfade merken, komplexe Filter beherrschen und Pivot-Tabellen mühsam konfigurieren.
Das kostet Zeit und schreckt viele Nutzer davor ab, ihre Daten überhaupt tiefergehend zu untersuchen.
Der KI-Agent von Odoo ändert das grundlegend. Wir zeigen Ihnen, wie Sie Ihre Daten ganz einfach genau so visualisieren, wie Sie sie gerade brauchen.
Inhaltsverzeichnis
Odoo KI als Datenanalyst
Anleitung: Berichte mit Odoo KI-Agenten erstellen
Schneller analysieren mit Odoo KI
Odoo KI wird zum persönlichen Datenanalysten
Komplexes Reporting erfordert oft Expertenwissen oder sogar Programmierkenntnisse.
Wenn man nicht weiß, in welchem Dashboard sich das richtige Menü versteckt oder wie man die Gruppierungen korrekt einstellt, bleiben die wertvollen Daten ungenutzt.
Mit Odoo KI beschreiben Sie einfach in natürlicher Sprache, was Sie sehen wollen. Der KI-Agent fungiert als Ihr persönlicher Datenanalyst und übersetzt Ihre Anfrage direkt in die richtigen technischen Schritte.
Das bietet Ihnen das neue Reporting:
- Zeitersparnis: Komplexe Analysen entstehen in Sekunden.
- Daten für alle: Jeder Mitarbeiter kann Berichte erstellen, nicht nur Power-User oder die IT-Abteilung.
- Alles in einem System: Die KI arbeitet direkt in Odoo. Sie müssen keine Daten mehr exportieren oder in externe Tabellenprogramme wechseln.
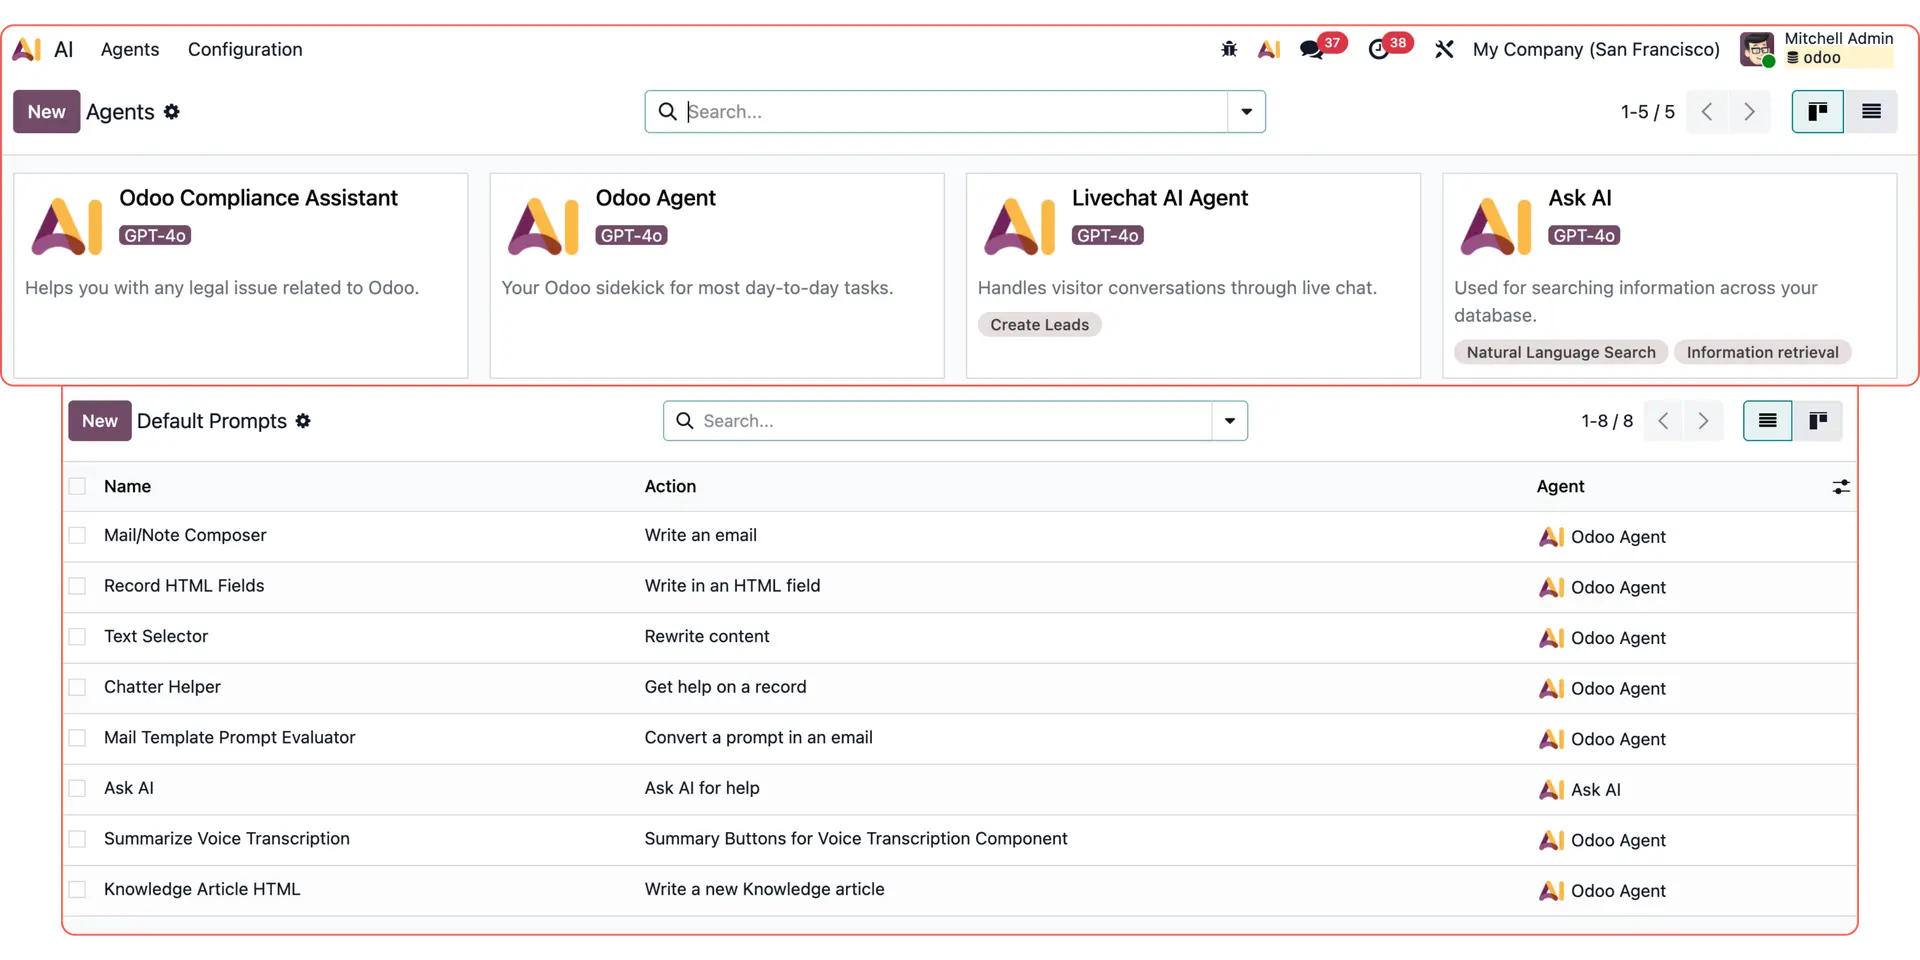
Odoo 19 führt autonome KI-Agenten ein
Mit der Version 19 hat Odoo den Weg für eine autonomere KI geebnet und bietet integrierte Agenten wie Ask AI, den Odoo Agent, den Compliance Assistant sowie den Livechat Agent an. Darüber hinaus können Nutzer nun ihre eigenen agentenbasierten KI-Workflows erstellen.
Entdecken Sie weitere Odoo KI-Anwendungsfälle:
Individuelle E-Mail-Antworten: Erstellen Sie dynamische Texte mit Odoo KI.
Reporting & Datenanalyse: Nutzen Sie Odoo KI-Agenten für Auswertungen.
Follow-up-E-Mails: Automatisieren Sie das Nachfassen per KI.
Livechat-Leads: Antworten Sie Interessenten sofort per KI-Agent.
Odoo AI Studio: Nutzen Sie intelligente Felder direkt in Studio.
Datenzusammenfassung: Lassen Sie Datensätze kompakt aufbereiten.
Wissensmanagement: Klären Sie Fragen anhand interner Dokumente.
So generieren Sie Berichte mit Odoo KI-Agenten
Erfahren Sie, wie der Odoo KI-Agent aus einer einfachen Frage einen umfassenden, interaktiven Bericht macht.
1. Frage stellen und Kontext liefern
Statt mühsam nach Verkaufsaufträgen zu suchen und sich durch Filter zu klicken, öffnen Sie einfach den Odoo KI-Chatbot am oberen Bildschirmrand.

Schreiben Sie Ihre Anfrage so auf, als würden Sie mit einem Kollegen sprechen.
Wir haben die Odoo KI in unserem Beispiel nach dem Gesamtumsatz für einen bestimmten Kunden gefragt – inklusive einer Aufschlüsselung nach Jahren und den Umsätzen pro Vertriebsmitarbeiter in einer Pivot-Tabelle.
2. Der KI-Agent übernimmt die Analyse
Die KI versteht den Kontext und führt die technischen Schritte für Sie aus. Sie erledigt automatisch Folgendes:
- Daten abrufen: Sie zieht die Infos aus dem Verkaufsmodul (z. B. Berechnung des Gesamt- und Jahresumsatzes pro Kunde).
- Ansicht wechseln: Sie schaltet die Anzeige auf die gewünschte Darstellung um (z. B. Pivot-Tabelle, Grafiken etc.).
- Gruppierungen setzen: Sie ordnet beispielsweise die Kunden in den Zeilen und die Vertriebsmitarbeiter in den Spalten an.
3. Ergebnisse nach Bedarf anpassen
Das Ergebnis ist kein statisches Bild, sondern voll interaktiv. Die generierte Pivot-Tabelle lässt sich jederzeit in andere Diagrammtypen umwandeln.
Sie können die Daten wie gewohnt erweitern, weitere Dimensionen hinzufügen oder das Endergebnis für Ihre Präsentation exportieren.
Intelligentes Reporting über alle Apps hinweg
Der KI-Agent funktioniert in allen Odoo-Apps. Jede Anwendung hat ihre eigenen Stärken, aber alle profitieren vom intelligenten Reporting:
Daten sofort filtern
Im CRM können Sie einfach sagen: „Zeig mir alle bestätigten Leads aus diesem Monat“ – und die Ergebnisse sind sofort da.
Ansichten wechseln
Wechseln Sie zwischen Kanban-, Listen- oder Grafikansichten allein per Textbefehl.
Trends erkennen
Fragen Sie nach Vergleichen zwischen verschiedenen Zeiträumen, ohne manuell Datumsfilter setzen zu müssen.
Automatisieren Sie Ihr Reporting mit Odoo KI
Haben Sie Fragen zur Einrichtung oder möchten Sie wissen, wie Odoo KI Ihre Datenanalyse verbessern kann? Unser Team hilft Ihnen gerne dabei, das volle Potenzial Ihrer Unternehmensdaten auszuschöpfen.